Our latest release (3.10) brings an all-new Trend Reports and better handling of recurring item transactions that don’t match the recurring item amount.
The Trend Report is a graph of spending and income over time. You can see a Trend Report for your Safe-to-Spend categories, for your Funds, or for your Recurring items. The Trend Report also includes a new search feature to search for specific vendors or amounts and the graph dynamically adjusts.
We’ve also improved handling of recurring item transactions that don’t match the set amount for the recurring item. This helps account for recurring bills that might have some variability to them, like water or power bills, and is also incredibly helpful for handling variable income. When a transaction is mapped to a recurring item but the amount of the transaction does not match the recurring item amount, you now have the option to create an adjustment transaction to handle the difference.
Read below for more details on all these new features.
Trend Reports
The Trend Report is a bar graph of your spending and income over time. There is a Trend Report in three places: Safe-to-Spend Categories, Funds or Recurring Items.
Safe-to-Spend Category Trends
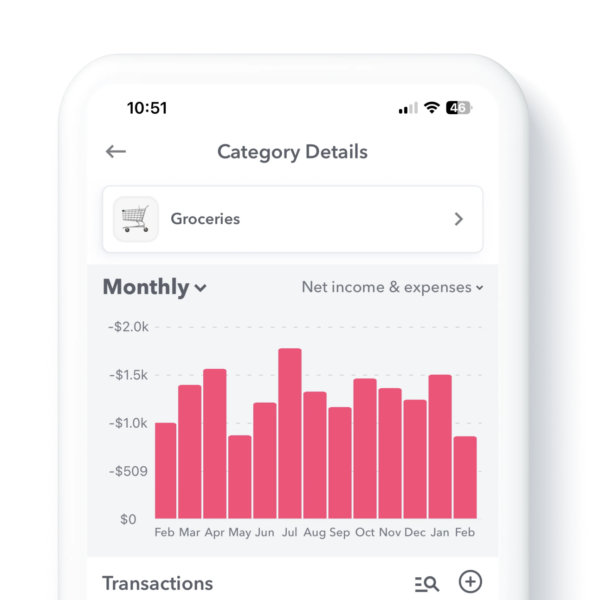
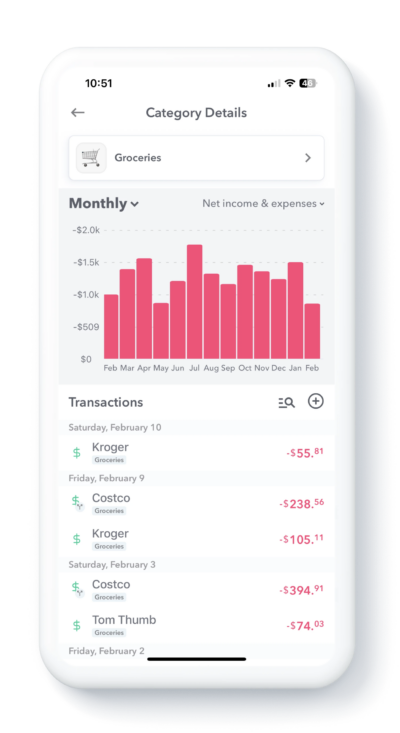
To find the Trend report for Safe-to-Spend categories, first open your left side navigation bar and then tap “Reports”. From there you will see the category spending for the current month. Tap any category to bring up the Trends Report for that category.
At the top of the screen you will see a bar graph indicating the spending over time and down below you will see a list of all the transactions in that category.
So, if you wanted to see, for example, how much you spent on “Groceries” per month over the past year, you can. Just tap on “Groceries” and it will bring up a screen with all your grocery spending.
Report views
You can also modify the report to see the data in different ways.
Tapping the top left of the report you can change the interval from “Monthly” to “Yearly”.
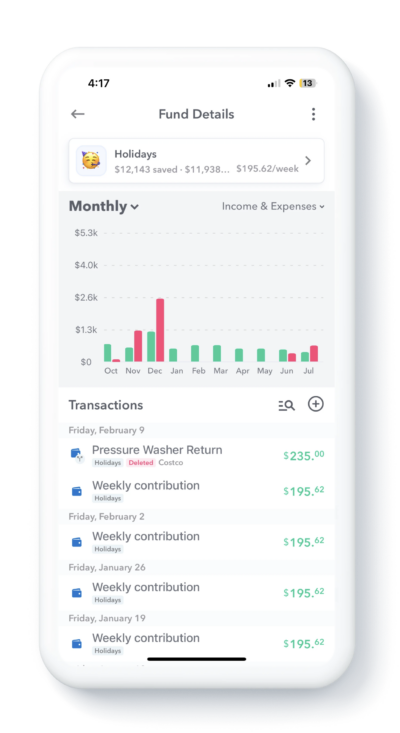
Tapping the top right of the report will allow you to adjust what transactions are represented in the bar graph: Income Only, Expenses Only, Income & Expenses or Net Total.
- Income Only – Select this option to only show transactions in the category that are positive (ie: income) transactions. For Safe-to-Spend categories this could be things like money back or credits for returns.
- Expenses Only – Select this option to only show transactions in the category that are negative (ie: expense) transactions.
- Income & Expense – Select this option to see both income and expense transactions side-by-side.
- Net Total: Select this option to see a bar graph where the income and expenses are combined.
Search Transactions and the Graph Adjusts
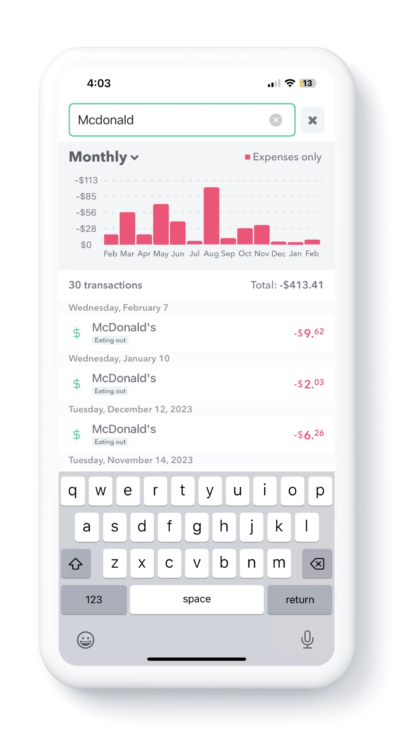
Inside of Trend Reports, you can search for specific vendors or transactions. So let’s say you were in your “Eating Out” category and wanted to see how much you spent at “McDonald’s”. To search, drag down from the top of the screen to bring up the search box. Then type in the name of what you want to search for – say “McDonald’s”, for example – and then the report will show just your purchases from “McDonald’s”.
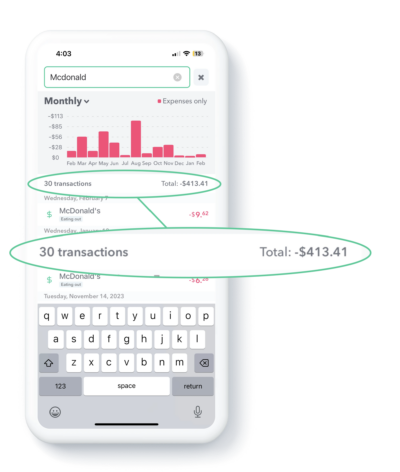
Notice also when you enable the search, the report will show the number of transactions that match your search and the total of those transactions.
Fund Trends
You can also see your Fund Activity in a Trend Report. To find the report, open the left navigation and tap “Funds” and then tap any fund. The graph will show at the top of the screen. You can optionally tap the top right of the graph and select “Income and Expenses” to see a side by side graph of the money added to a fund and then spent from it. Use the search to find transactions within a fund.
Recurring Item Trends
You can also get a view of all your spending on recurring items. If you click on your recurring budget item and see a chart of all the transaction assigned to those recurring budget items.
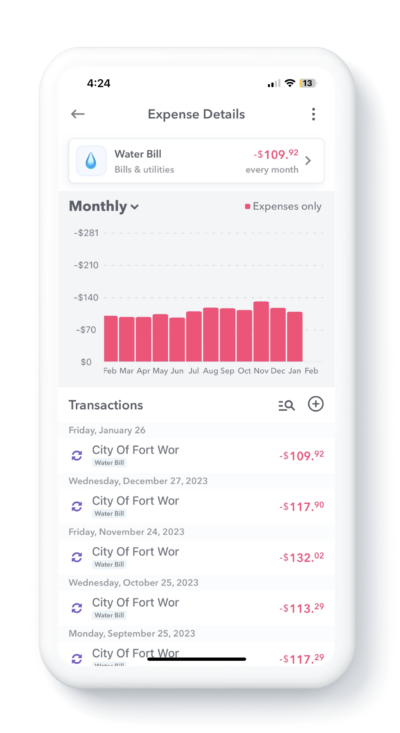
You can do the same for any of your Recurring Income Items. This can be especially helpful for visualizing variable income over time.
Handle Variable Income and Expense Transactions with Adjustment Transactions
When new transactions are downloaded from your bank that don’t exactly match the value of a recurring income or expense budget items, you can now create adjustment transactions to account for the difference.
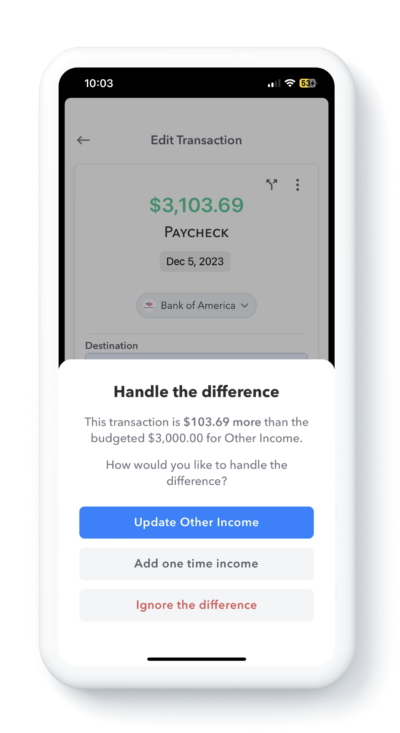
When the transaction comes in and you map it to your recurring income transaction that is of a different amount, Weekly will prompt you to ask what you want to do with the difference.
- Update Other Income – This will change your budget item to match the income of this transaction
- Add one time income – This will keep your budget item the same and will create a one-time adjustment transaction that you can add to safe-to-Spend or a Fund.
- Ignore the difference – This will neither add a one-time transaction or change the recurring income transaction.
This is especially helpful for dealing variable income transactions. So for example, if you have budgeted bi-weekly income of $3,000 but because of additional hours at the job or a bonus, the income came in as say $3,103, you can create an adjustment transaction to add the extra $103 to your Safe-to-Spend or to a Fund.
The adjustment transaction popup screen automatically appears when you try to map a transaction to a recurring budget item and the amounts don’t match asking you how you would like to handle the difference.
If you choose to “Add one time income” (or “Add one time expense” in the case of a negative difference), then the next pop up screen will ask you where you would like to put the extra money (or in the case of an expense, take the extra money).
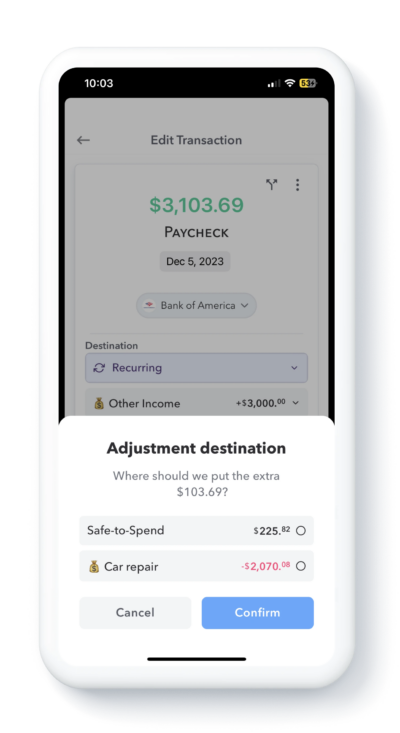
Adjustment transactions can also be used to handle expenses that come in over or under the budgeted amount. So, for example, if you have a budget item that is $100 for Electricity but your actual bill came in as $110, Weekly will ask where you want to get the extra $10 from or if you just want to ignore the extra amount or change the budget item to match the current transaction. If you choose to create a one-time adjustment transaction, you can then take that extra money for Safe-to-Spend or a Fund (See more about How Funds Work).
A Couple More Goodies
Cash History Report
We changed the name of the Cash Over Time Report to the “Cash History Report” and large negative amounts have rounded bars to keep the graph from looking stretched.
Search from Any Page
We added the ability to search from anyplace in the app. To search, just pull down from top of the app.
Conclusion
You can download Weekly 3.10 now in the App Store. Let us know what you think of new features at [email protected].
