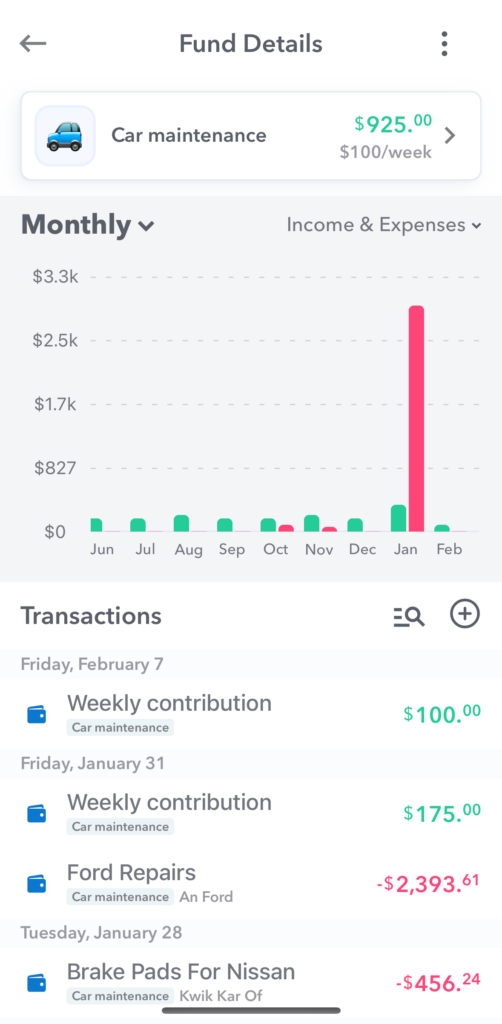
You can see a history of transactions in your funds. The graph at the top of the screen will visualize the value of the transactions associated with the fund.
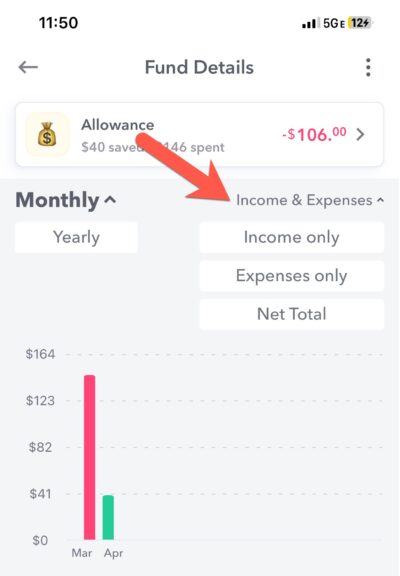
Toggle between “Monthly” and “Yearly” views by tapping on the top left of the graph.
You can also filter what transactions you see by tapping the top right.
- Income & Expenses – Shows both income and expenses
- Income only – Shows only positive income items
- Expenses only – Shows only negative expense items
- Net Total – Subtracts the expenses from income first and shows the result.